European Natural Gas & Electricity Market - Tulip Mania 2.0 & what the TTF Curve Structures Tells us About the 2025 Market
3 December 2024

The tulip mania (Dutch: tulpenmanie) was a period during the Dutch Golden Age when contract prices for some bulbs of the recently introduced and fashionable tulip reached extraordinarily high levels. The major acceleration started in 1634 and then dramatically collapsed in February 1637. It is generally considered to have been the first recorded speculative bubble in history.
In many ways, the tulip mania was more of a then-unknown socio-economic phenomenon than a significant economic crisis. It had no critical influence on the prosperity of the Dutch Republic, which was one of the world's leading economic and financial powers in the 17th century and maintained the highest per capita income in the world from about 1600 to about 1720.
However, it reminds us of the current wind and solar mania, where European bureaucrats, government officials, traditional media, universities and lobbying groups are caught up in a collective group think. And as in 1637, today’s failing energy policies can be observed in the Netherlands, too.
Natural Gas Balances: Netherlands
Once a global powerhouse of trade and a beacon of innovation with bicycles as their crown jewel, the Dutch struggle to pedal past their fossil fuel reliance as the green shift fails to deliver on its promises.
Of course, that didn’t stop its government from riding the fashionable green wave and cutting natural gas production from the Groningen field, one of the world’s 10 largest gas fields since its discovery in 1959, even ahead of schedule due to a combination of minor earthquake risks and an incompetent implementation of compensation payments to those affected (giving rise to adverse public opinion).
The result of it is that the Netherlands, a net exporter of natural gas for nearly 7 decades (!), is now starved of the energy upon which its industry and grid were built over the same decades.
The government has turned the country into a beggar for Norwegian pipeline gas and global LNG imports to keep its households heated, its grid stable, and its massive chemical industry going - albeit at much higher feedstock prices, as we will demonstrate - all because of green ideology and zero geopolitical risk management.
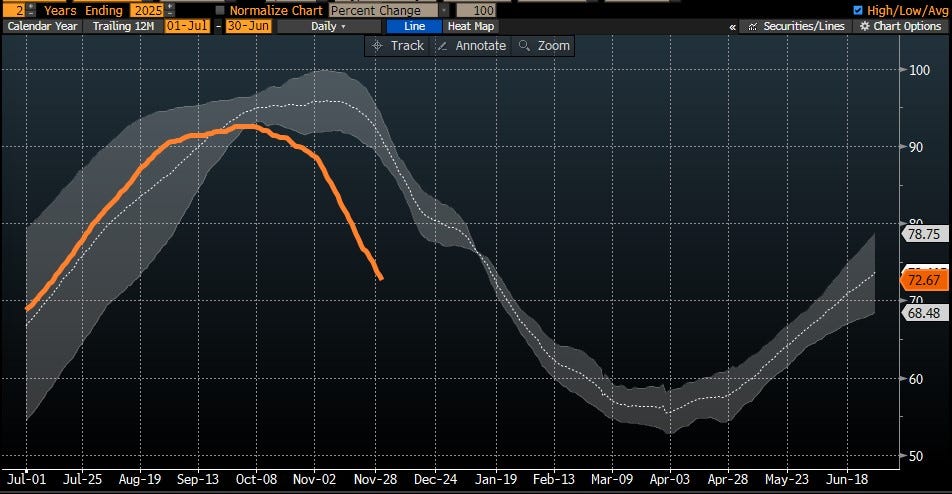
The problem now? An early winter and a fortnight of Dunkelflaute in November were enough to reduce Dutch natural gas storage by 20%, dropping from 93% to 72.67%.
But the Netherlands still faces up to five months of gas storage withdrawals, with the three highest-demand months — December, January, and February — yet to come.
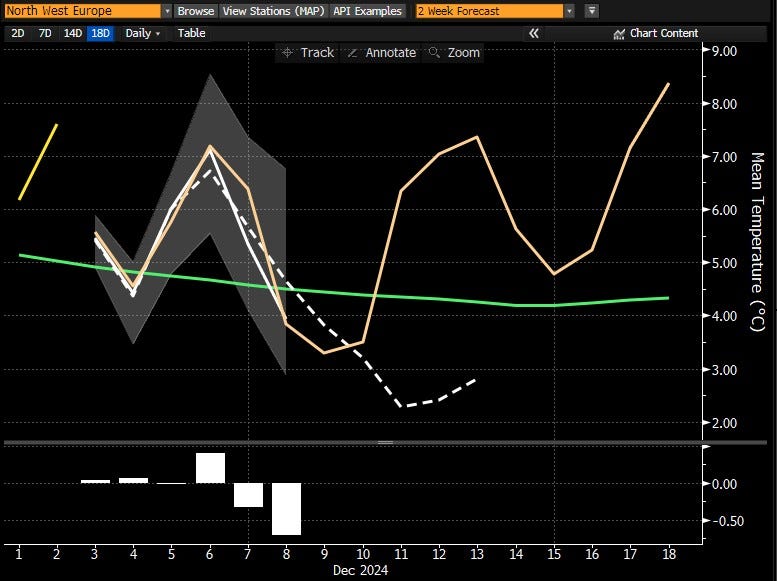
Our forecast doesn’t bode well either. We project Dutch households will consume 34% more gas than in December 2023 (4.7°C average temperature versus 7°C last year). The grid will likely require 0.55 bcm for power generation, 14% more than last year.
We also expect industrial consumption up by 15-20% versus year last, with both the chemical industry and the remarkable Dutch greenhouse horticultures industry continuing their post Gazprom recovery. While the latter obviously cannot compete with their Southern neighbours, they produce good tomatoes nevertheless.
This would cause storage levels to fall to 55% by end-of-December - lower than in 2017 when the Groningen field was still active and Dutch storage was a mere nice to have.
Dutch storage facilities are the 3rd largest in Europe with 144 TWh (about 12.5 bcm), after Germany (251 TWh) and Italy (200 TWh). What happens in Dutch storage facilities matters for European gas prices, which is why the European hub price - known as the Title Transfer Facility (TTF) - is priced in the Netherlands.
Of course, milder than expected winter temperatures in 2025 may bail the government out one more time. However, in our opinion, this gigantic bet on weather for national well-being — made by one of the most industrialized nations in the world and home to ASML Holding, without which the world literally cannot produce cutting edge semiconductor chips — looks like an accident waiting to happen, much like during the Tulip Mania !
NatGas Consumption for Power Generation
What was the Tulip in 1637 is the Wind turbine in 2024. The Dutch love their wind farms. And they are good at them too. The Netherlands has strategically embraced offshore wind power as part of its broader commitment to sustainability.
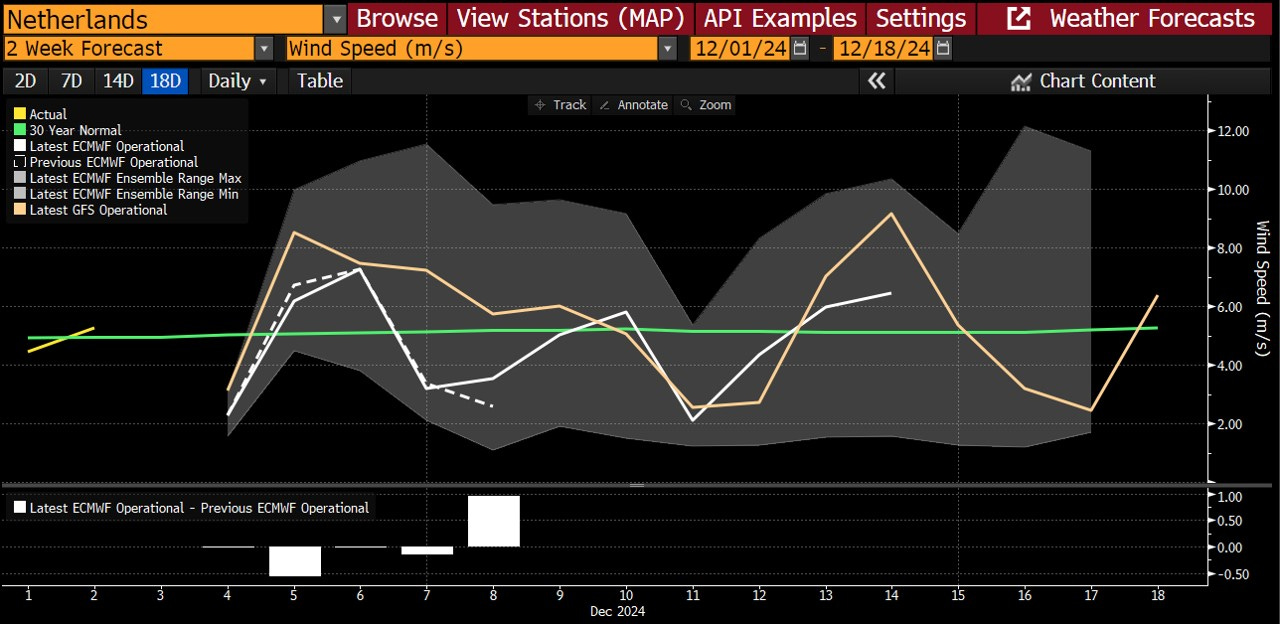
For instance, the Gemini wind park is one of the largest in the world, with more than 150 wind turbines, located 85km off the coast of the Netherlands. According to the operator, Gemini's sweet spot lies where winds average 10.2 to 10.4 m/s. Well, let’s hope somebody explains that hyper narrow range to the weather god off the coast in Amsterdam because they are not listening.
We know what you are thinking. This forecast is perhaps not representative enough, as Gemini will have certainly carefully selected the best possible location for its wind farm. Well, try to recreate it yourself with the App Windy.com. We did it for you.
Their location is indicated by the white dot. The wind speeds shown below are referenced at 100 meters height which is quite close to Gemini’s wind turbines’ hub height of 89 meters.
Looking at the wind speed range in the table below illustrates clearly how difficult it is even for a good offshore wind farm to perform within its advertised sweet spot.
With renewables, the only certainty is uncertainty in result. That is the enemy of a stable grid.
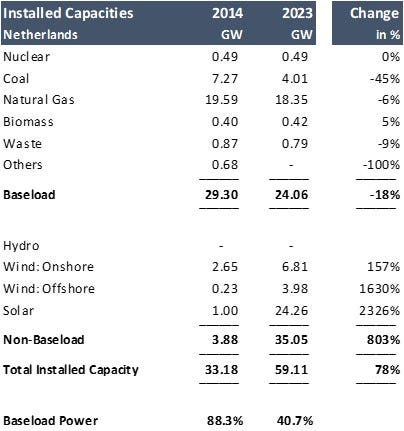
Such simple-to-comprehend realities didn’t stop the Dutch government from going all in on renewables. More concretely, the Dutch government has reduced its baseload generation capacity by 18% in the past decade and has increased their renewable capacities ninefold to 35GW - just like in the Tulip Mania!
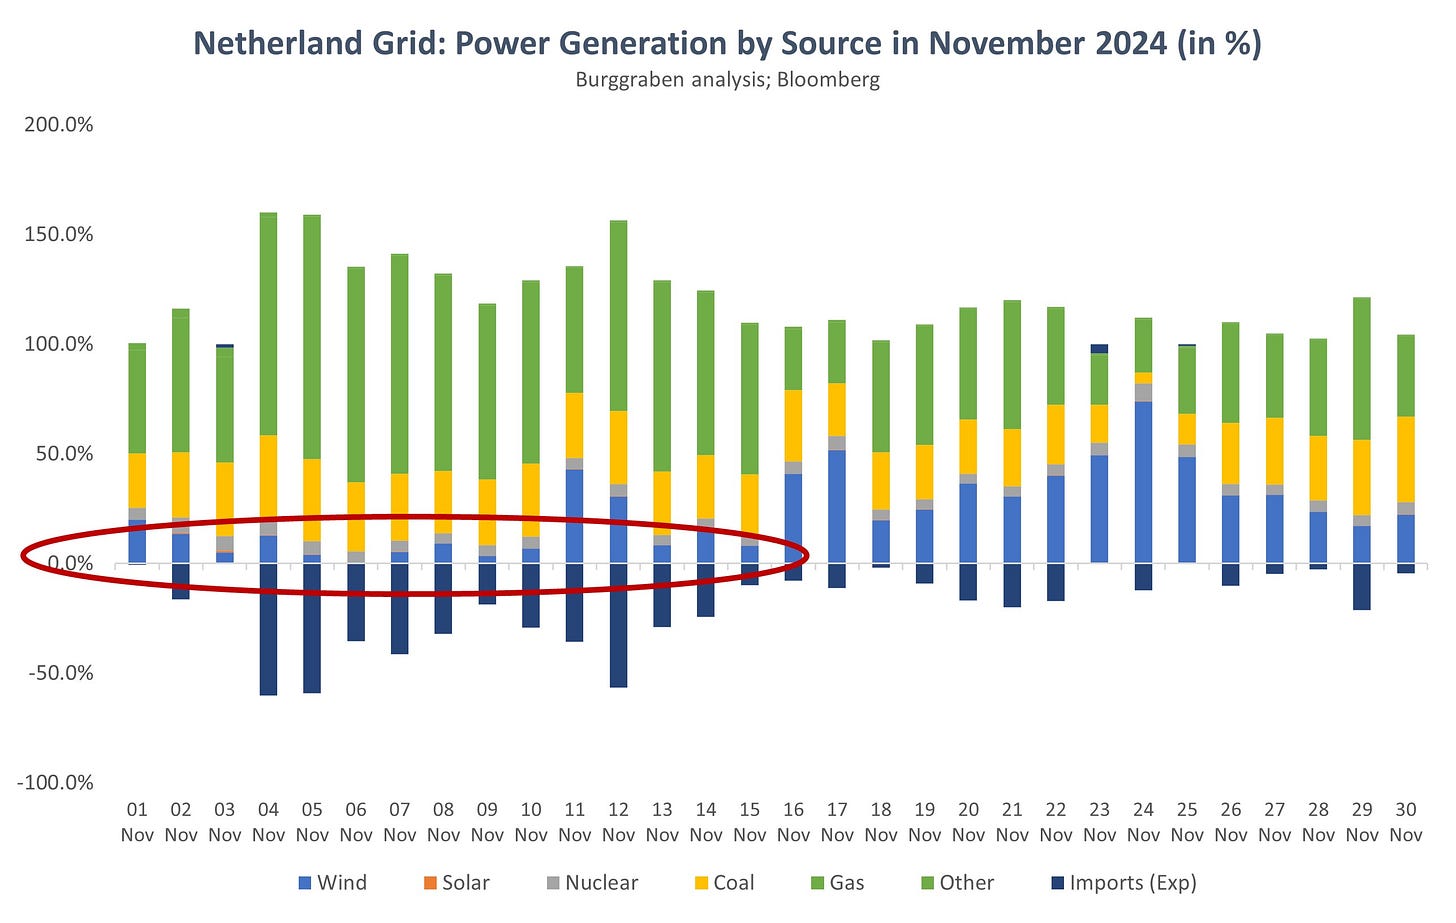
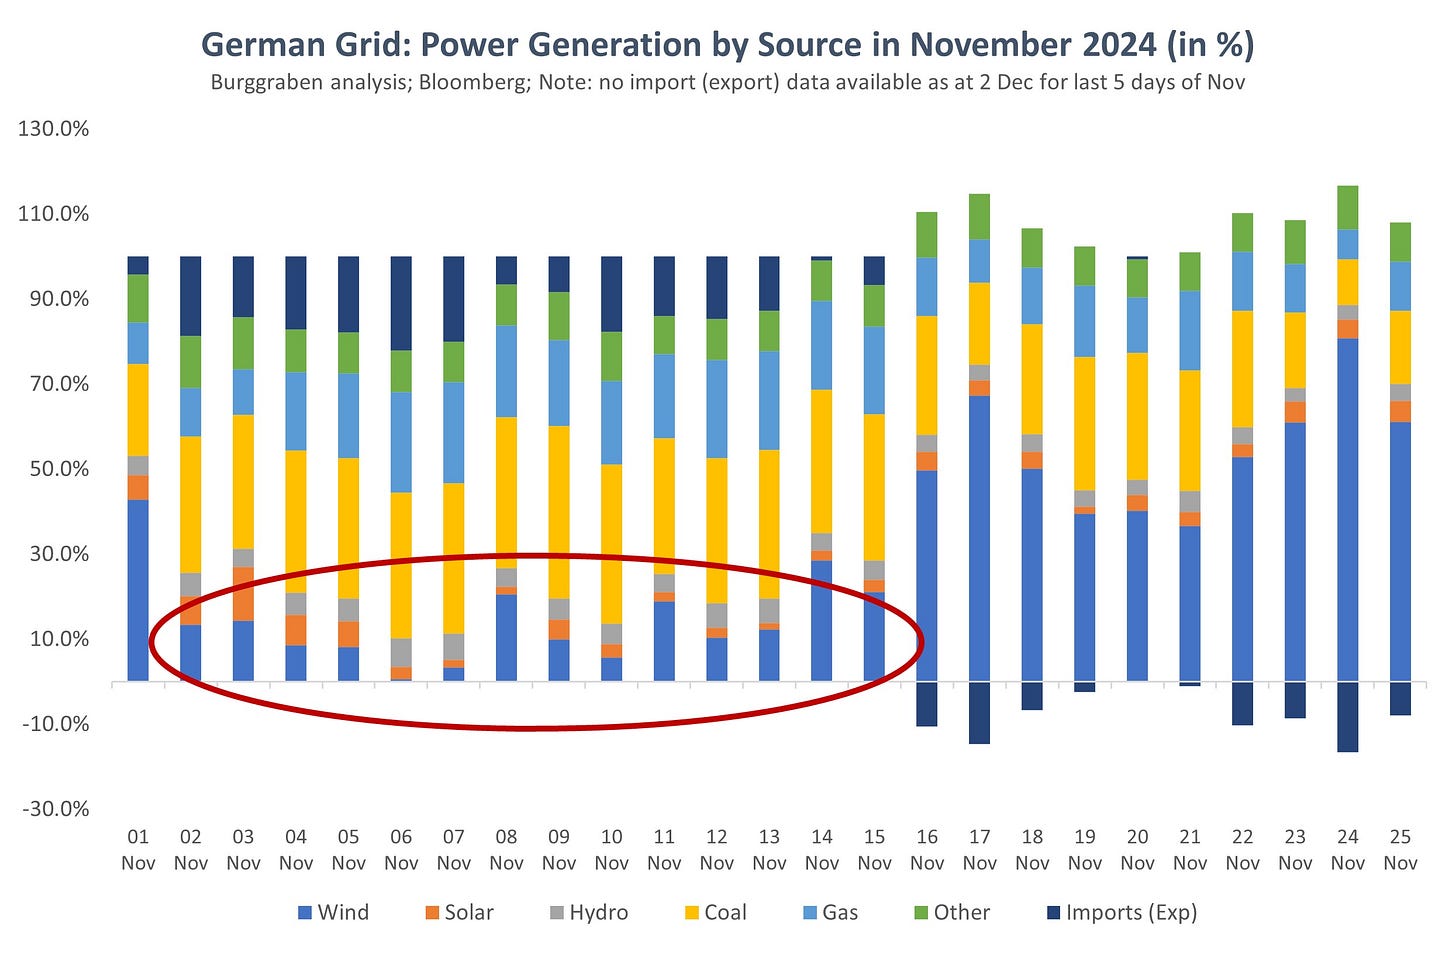
But if Tulips are seasonal, wind and sunlight are even more fleeting. In November, Northwestern Europe had 14-days of Dunkelflaute (red circle below) — a period with little sunlight and wind. That meant that the Dutch operators had to turn on all its fossil-fuel based capacities to meet its domestic power demand (also known as load).
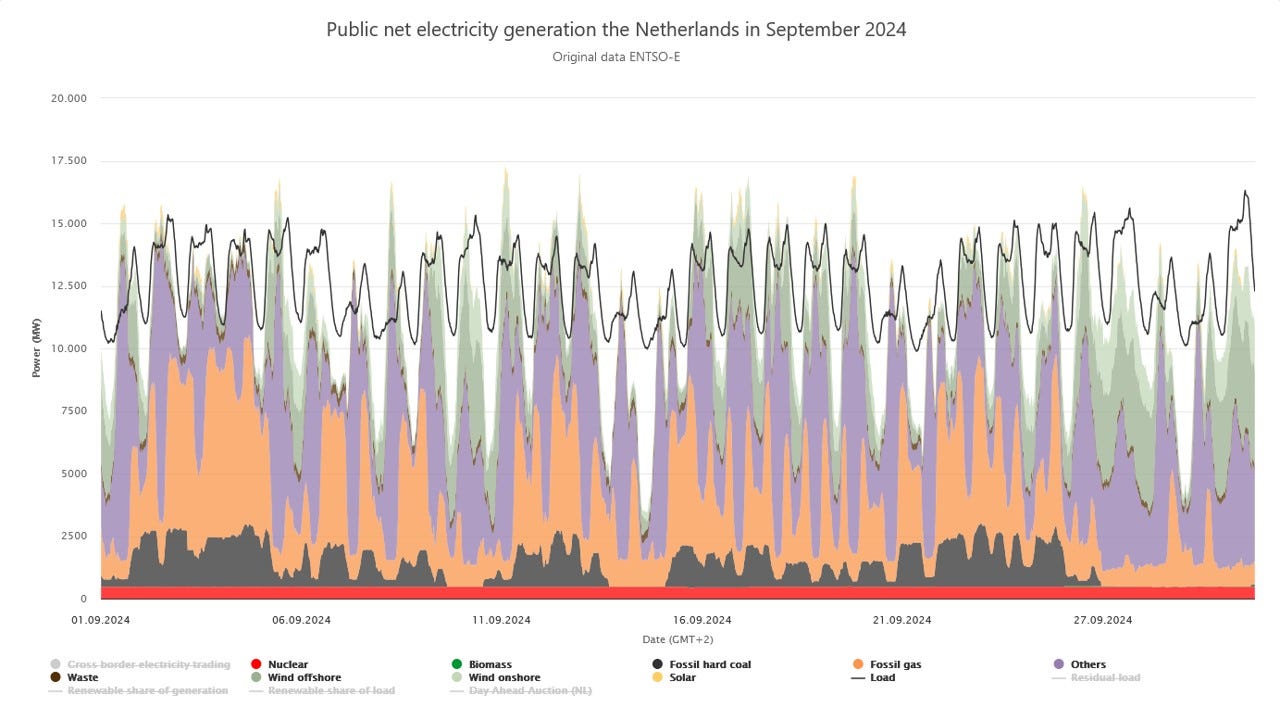
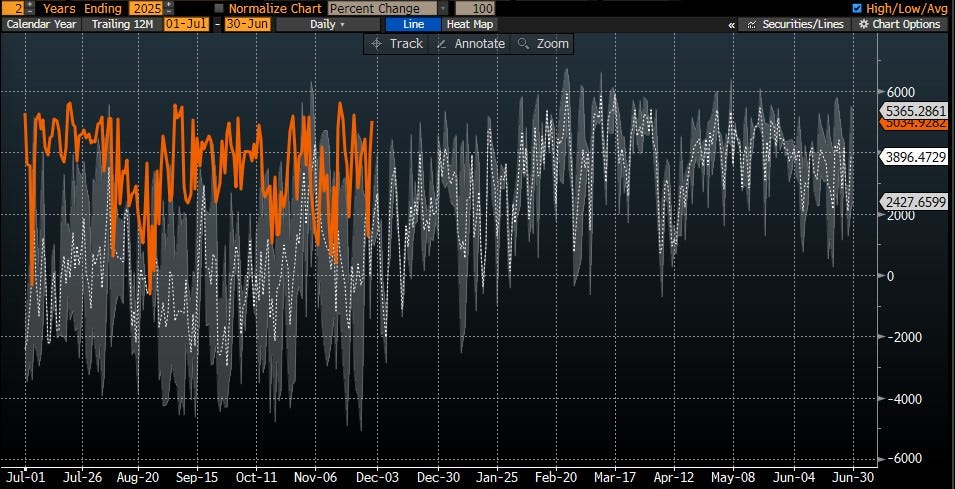
And no, November wasn’t the exception. Insufficient electricity coverage is the rule. Take the month of September. Whenever there is a white field below the black line, which represents the Netherlands’ load (power demand), the local operator wasn’t able to produce enough electricity to match its domestic demand. Not good.
Let us repeat what we explained earlier: the Dutch struggle to pedal past their fossil fuel reliance as the green shift fails to deliver on its promises. Doubling down on such a strategy won’t change the result.
As often attributed to Einstein: “Insanity is doing the same thing over and over again and expecting different results.”
Bailing Out Belgium
To be fair to the Dutch, some of their higher gas consumption in November wasn’t domestic in nature. Instead, the Dutch electricity transmission operator TenneT exported electricity to Belgium as they too struggle from the same “Tulip Mania”.
Their situation was worsened by Belgium's decision to shut down two nuclear reactor units — Doel 3 and Tihange 2 — in 2022 and 2023, though they aren't yet decommissioned. This move has reduced Belgium's installed nuclear generation capacity by 40%, from 5 GW to 3 GW.
This significant baseload power gap must now be partly filled through a combination of coal and gas-powered electricity imports from the Netherlands and nuclear power imports from France. One should wonder: what were all these policymakers thinking when they decided to reduce baseload power without baseload replacement?
A Cortés Moment?
The phrase “burning your ships” originated in 1519, when a Spanish expedition led by Hernán Cortés landed in Mexico. Cortés knew his crew were already exhausted after the long sea journey, yet he needed to ensure their absolute commitment to succeeding in the new land. To eliminate any possibility of retreat, he ordered the scuttling of the ships in which they had arrived. With the ships burned, there was no turning back.
But the power grid is not the discovery of Mexico, and we do not need to reinvent the marvel of Europe’s synchronous grid. If cutting CO2 emissions is the goal, then coal power should be replaced with nuclear, not unpredictably intermittent wind and solar power sources without the necessary electrical grid-scale storage capacities attached to them.
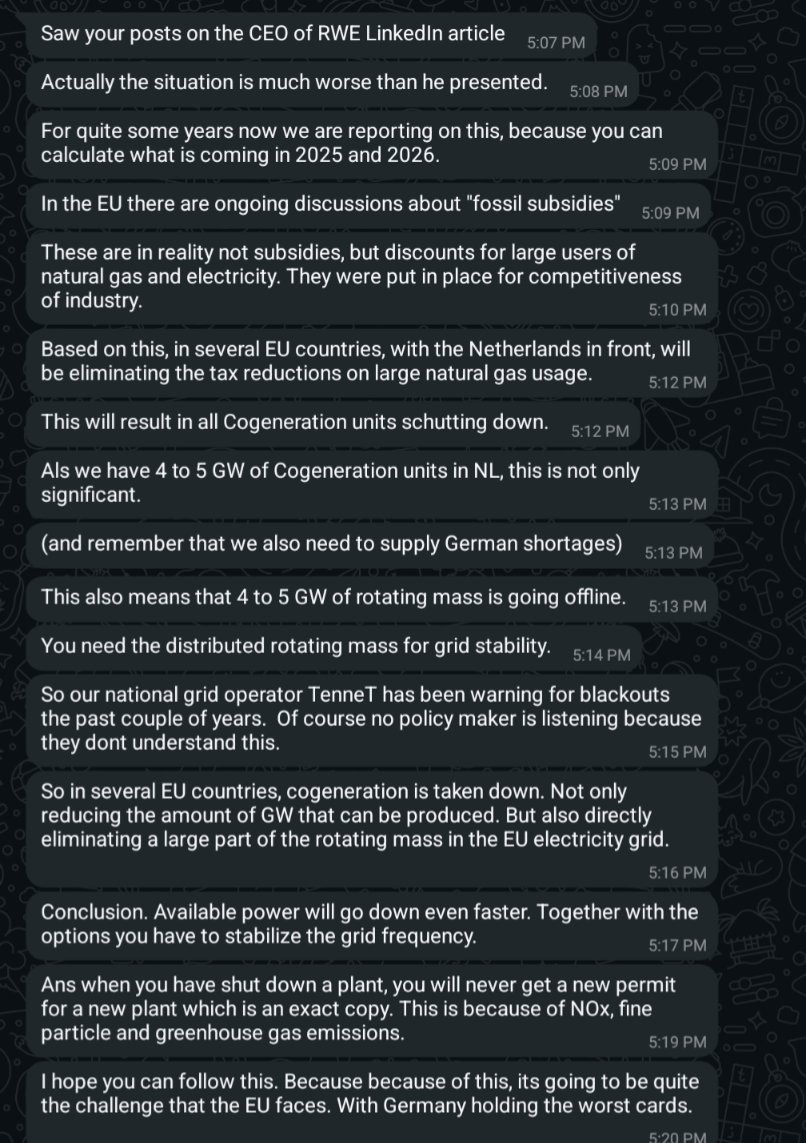
If you consider my criticism of green policies too severe, please study carefully this reply to Mark Nelson on X by a Dutch power expert and think again.
The current green policies, where intermittent power sources are supposed to replace baseload power from fossil fuels and, in some regions, nuclear power, will inevitably fail. In the worst case, if pursued as scheduled, they will lead to a supra-regional blackout that likely endangers lives.
As I like to say, the power grid isn’t an online retail start-up. Policymakers must stop treating it this way. Failure is not an option when it comes to electricity in emerged economies such as Europe and the United States. Our societies aren’t prepared to deal with daily necessities without being able to cook, to use their phones or credit cards or without being able to refill their cars for a few uncertain days without power.
Coal-to-Gas Switching?
Which brings us back to natural gas and the cost of producing electricity with natural gas versus coal and what the industry and traders refer to as fuel switching or coal-to-gas switching.
The math behind it is straightforward: both a coal- and gas-fired power plant require a given amount of energy calories to generate electricity. There is a point when operating a coal plant becomes cheaper than burning natural gas to produce electricity, and at this point, the operator switches
The switching cost metric signifies the price of gas at which gas-fired generation becomes more competitive than coal-fired generation, after factoring in operating costs, efficiencies, fuel expenses, and carbon pricing. Note that a coal plant emits twice as much CO₂ as a gas-fired plant. That means it has higher feedstock cost to justify the purchase of the necessary Carbon Emission Certificate to run the coal-plant. But coal feedstock can be cheap enough to compensate for that in relation to natural gas.
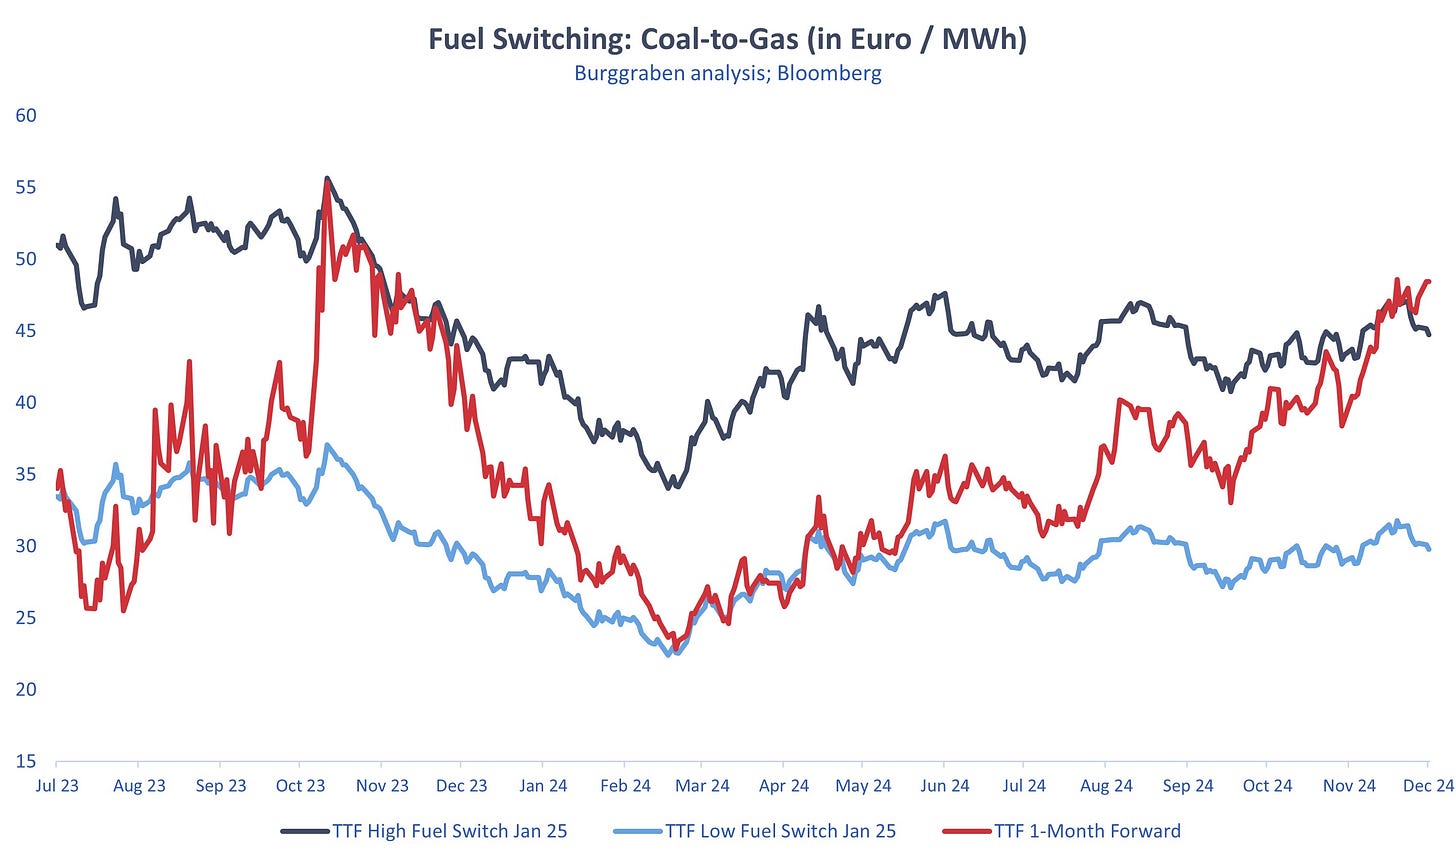
We can measure that trade off with an upper and lower fuel switch price (subject to the efficiency of the plant). At Euro 48.45/MWh, TTF front-month (red line below) has risen through the coal-to-gas switching range, signaling utilities to turn on their marginal coal plant and turn off some gas-fired capacities.
In theory, that should reduce natural gas consumption for electricity generation in December and January, ceteris paribus. But will it?
We have to wait and see. The issue we observe is that Europe has been burning many ships already. That means that the price incentives for coal-to-gas switching will likely become muted and won’t matter at all during a Dunkelflaute. Instead, capacity shortages have become the critical factor.
UK: Premature Baseload Capacity Reduction
Take the United Kingdom. It won’t switch to anything anymore. This is because Britain, the birth place of coal-fired power generation, has in September turned off the country's last coal power station at Ratcliffe-on-Soar, which was running since 1967. That marks a major turning point for the country after 142 years of reliable coal power generation for UK households.
We do not mind for policymakers to turn off coal plants and replace them with other baseload power such as nuclear. And Britain is indeed investing into modern nuclear power generation, with a stated goal to increase its nuclear output by 6x to 25 GW by 2050. So that is the good news.
The not-so-good news is Britain's timing in turning off coal, while it remains a net importer of electricity most of the time, having insufficient baseload power generation capacities for the country to function independently 24/7. Britain requires about 260 GWh of electricity per annum and imports up to 20% of its shortcomings mainly from France’s nuclear fleet but also from the Netherlands (coal & natgas), Denmark (wind) and Norway (hydro).
At least Britain's offshore wind generates better results than most of Europe's wind portfolios, due to its naturally better wind speeds around the island. But it's still intermittent, and so we expect significant ongoing natural gas consumption in the UK for power generation this winter to keep the grid stable.
Germany: Failed Energiewende
Which bring us to the German grid. It, of course, experienced the same 14-day Dunkelflaute in November. However, Germany's installed power capacity has already been partly “burned down” by Angela Merkel and current government.
In fact, the Energiewende Netzentwicklungsplan 2037/45 (Energy Transition Network Development Plan 2035, see page 26) requires the complete phase-out of all fossil power sources in the next decade, with only 53 GW of natural gas powered electricity generation provided for baseload purposes (i.e. the power that isn’t dependent on weather or battery storage system to deliver power 24/7).

As most of you will know, Germany has already completed its nuclear phase-out, with the shutdown of the country's final 11 GW of nuclear power capacity occurring in April 2023. Luckily, not all of its plants have been decommissioned just yet.
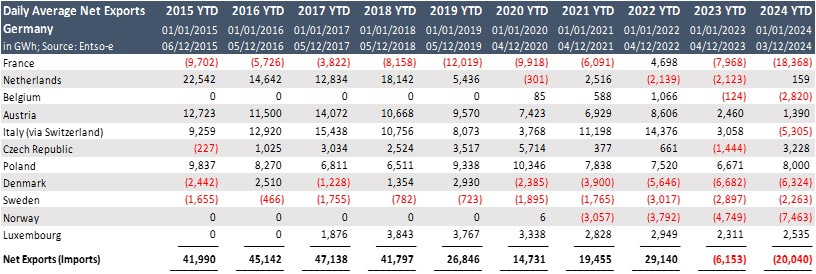
These policies have already transformed Germany from a net power exporter into a net importer of electricity. Prior to 2011, nuclear power alone generated more than 25% of Germany's electricity from 17 of the world's safest nuclear power plants.
For perspective: the exported electricity of 47,138 GWh (or 47.1 TWh) by Germany in 2017 Year-to-Date (table below) equalled roughly the annual consumption of Portugal or Hungary today.
Germany has Europe’s largest power grid, with an annual load of 500 TWh (twice as big as the UK grid). Bailing Germany out in future Dunkelflauten will become increasingly difficult, ultimately reaching breaking point.
This is especially likely because neighboring states have not implemented the necessary cross-border transmission capacity for Germany's Energiewende — a large-scale energy transition that remains uncoordinated with other European countries but will, on its own, determine the stability of the European grid, as we detailed here.
More concretely, November 1 to 15, 2024, every installed capacity source in Germany had to produce at full potential and yet Germany had to import up to 22% of its required electricity consumption to keep the lights on. Energy poverty at its finest, and entirely self-inflicted, too. Nor is that shift “green” where we sit.
Record European Natural Gas Storage Draws
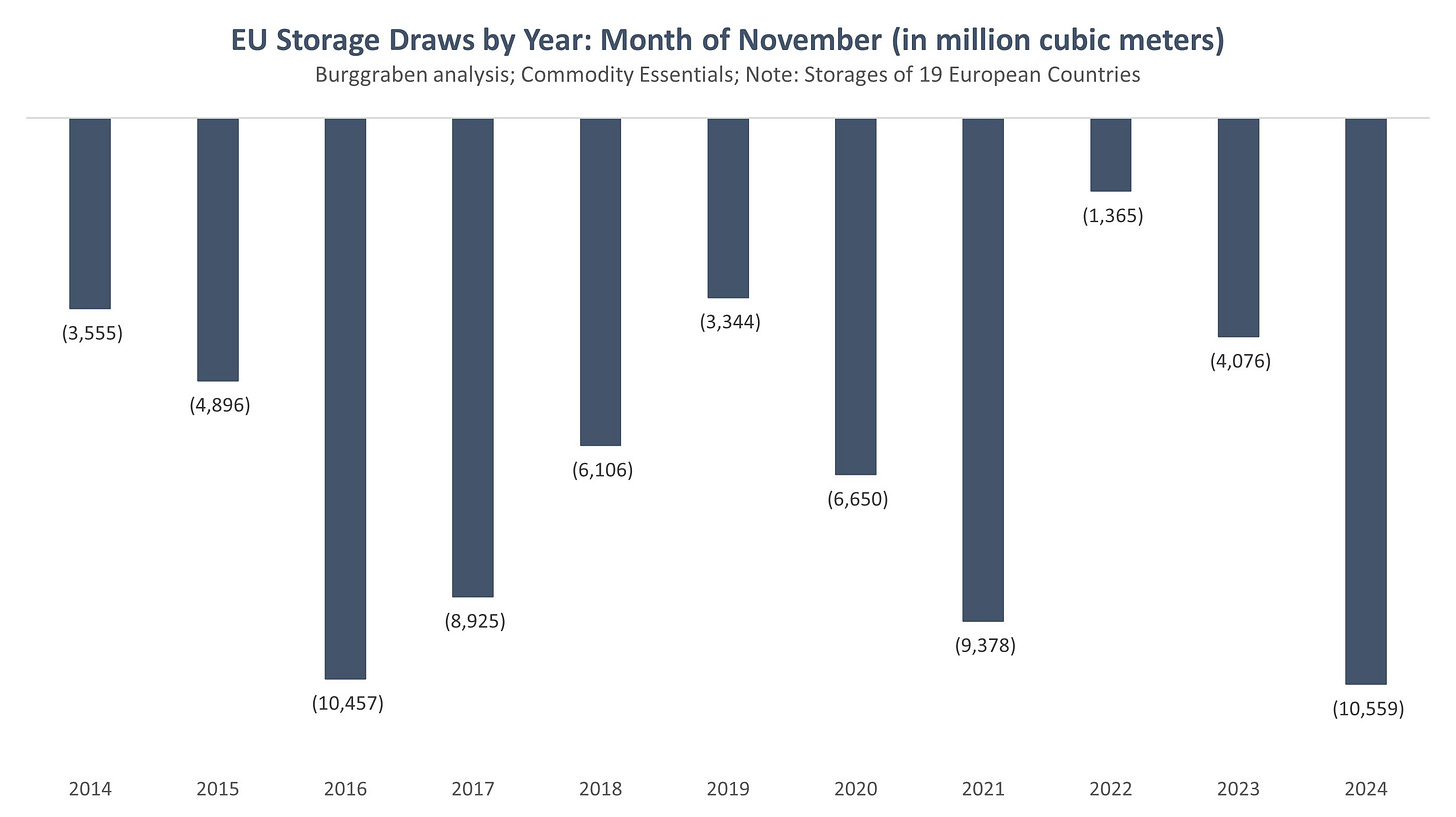
The shortcomings due to high renewable shares in the European grid explains partly why Europe just experienced its largest November storage withdrawals since record-keeping began. Notably, this occurred despite neither particularly cold weather nor higher-than-usual electricity demand for November.
Instead, Europe has become natural-gas-supply-constrained and hypersensitive to securing adequate LNG imports to avoid severe storage drawdowns. However, those are the same LNG imports Asian countries will be competing for in 2025 and thereafter. After all, Asian countries understand the importance of cheap, reliable energy sources for the prosperity of its people.
TTF Futures Curve: Tight LNG Market Until 2026
A look at the forward curve suggests that this situation will improve only in 2026, when sufficient new liquefaction capacity, mainly from the U.S., comes online to meet additional demand without higher prices. However, given the industrial complexity of such projects, even these timelines are likely to face delays.
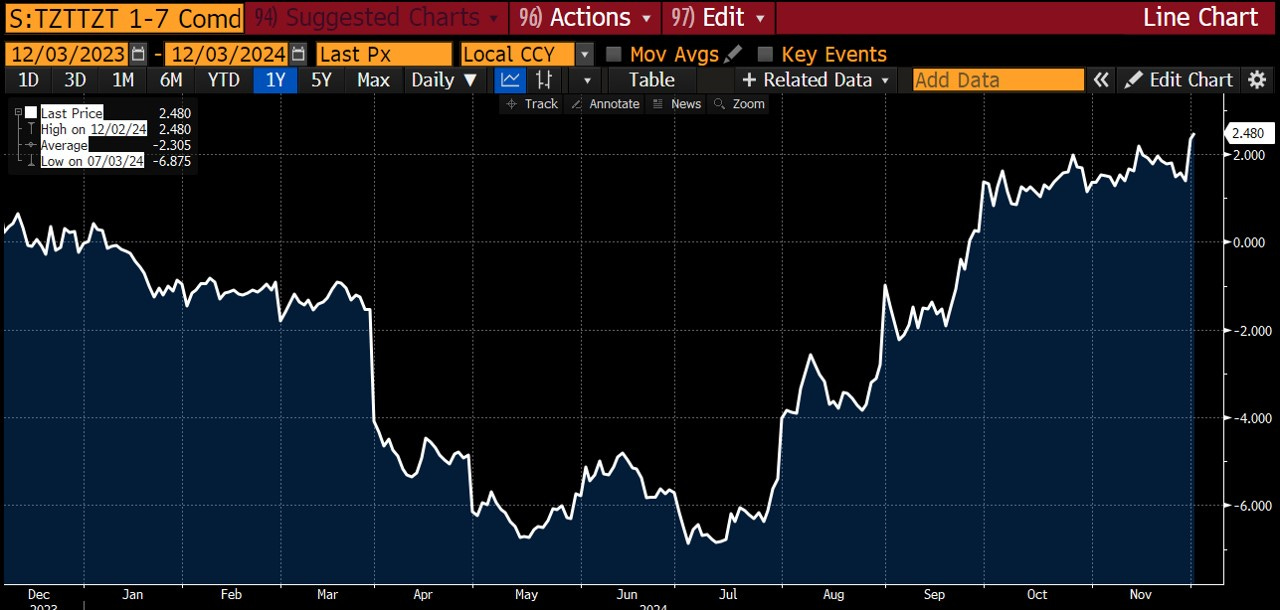
Another way of analyzing this is through a closer look at the TTF structure by deducting a future summer contract month, such as July, from the January contract months (what's called "1-7" spread in the graph just below).
Typically, TTF should be cheaper in summer than winter, as Europe then consumes only a fraction of its winter gas consumption (as detailed in episode 1). Therefore, summer LNG imports serve to refill depleted storage. The faster the storage fills, the fewer LNG imports are ordered, leading to lower LNG prices entering autumn.
However, the TTF curve structure has now inverted, showing higher prices for July 2025 versus January 2025. The market is signaling two things: (a) Europe may require significantly more LNG than will be readily available in 2025, and (b) July prices will need to be higher than current levels to redirect cargoes away from Asia and into Europe.
What is our message? Unless temperatures become significantly milder than our current best-estimate forecast suggests, expect high gas prices to go even higher and to remain elevated well into summer. This sustained increase in gas prices will inevitably translate into higher electricity costs for consumers.
Risk to Outlook
The temperature forecast for Northwestern Europe remains for colder than normal weather in the coming days. However, winter has only just begun, and this cold spell could give way to milder temperatures in January.
Should such a milder weather pattern emerge, the overextended market positioning would likely lead to a sharp price correction.
Is a net long position of 279 TWh of long TTF contracts significant? It depends. On the one side it is more than during the Gazprom Crisis 2021, when Gazprom left its European storages unfilled (even higher speculation was likely prevented during 2022 by lawmakers and counterparties).
On the other hand, 279 TWh of gas represents approximately 27 bcm in a 370 bcm physical market, or 7.3%. In crude oil, paper speculation is a multiple of the overall physical market. So we will have to see if speculators take positioning a lot higher from here. We simply don’t know.
“Electric” Thought For Policymakers
European policymakers show little inclination to question their current green policies. However, doubling down on intermittent energy sources such as wind and solar won’t deliver more energy during a Dunkelflaute.
Instead, this approach will lead to energy poverty, higher electricity and natural gas prices and, in the worst-case scenario, a supra-regional blackout. Such a blackout could take days or even weeks to resolve due to insufficient rotating mass (the physical inertia provided by conventional power plants).
Remember, electricity has never been solely about energy generation — it has always been about timing and location as well. Timing — matching electricity consumption with generation — requires baseload power that grid operators can rely on regardless of weather conditions minute by minute.
Certainly, a reliable grid needs objectivity about the opportunities and risks of renewable power sources, not green lobbying by the Fraunhofer Institute and the German Government in order to misrepresent the unit cost of nuclear energy. Who do these people think they are, lying in our faces, paid for by the taxpayer?
Wind and solar generation increases electricity prices for domestic consumers. This occurs because these technologies require subsidies to compete with traditional, more energy-dense power sources such as nuclear, as fewer and fewer locations deliver healthy returns on capital for renewable developers and operators of wind and solar farms. We know it first hand. We have done wind investments in our previous life in Private Equity. Getting a wind farm right is tough business, even with subsidies.
More importantly, renewables require substantial grid infrastructure investments for power transmission to consumption centers - the location part of electricity. Before the Energiewende, power plants were built next to where consumption grew. That didn’t require a re-making of the grid, apart from adding distribution lines to it.
The green shift, however, newly requires the transportation of electricity generated in the North Sea by offshore wind also to consumption centres in the Bavaria or Baden Württemberg for it to work. That requires Germany to double its transmission grid, the slow progress of which you can monitor here. Why is it slow? Because nobody wants a transmission line to destroy the value of the property value.
Again, the expansion of renewables means to double the grid as decentralised offshore wind generation in the north needs to be transported to where it is industrially required (mid & southern Germany). In other words, the system costs to integrate renewables are immense - we mean trillions for Germany alone.
This is why Denmark, the UK or Germany - with their large installed base of onshore and offshore wind as well as solar portfolios - have the highest electricity prices for consumers GLOBALLY according to the calculations of the UK Government.
Herein lies the problem of the European Green Deal. Politicians and think tanks have sold wind and solar as free energy (wind & sun do not send invoices). But that was one of many energy lies as electricity is a complex system that requires significant investment to integrate renewables into the grid. That comes as a daily service, with immense management cost for numerous reasons.
Such investment and service cost are charged to consumers in the form of taxes and levies in their monthly invoices from system operators. Have consumers ever agreed to significant higher electricity or vegetable prices — to what we like to call “greenflation”? Or have they been told that the German Energiewende comes at the price of an ice cream per person?
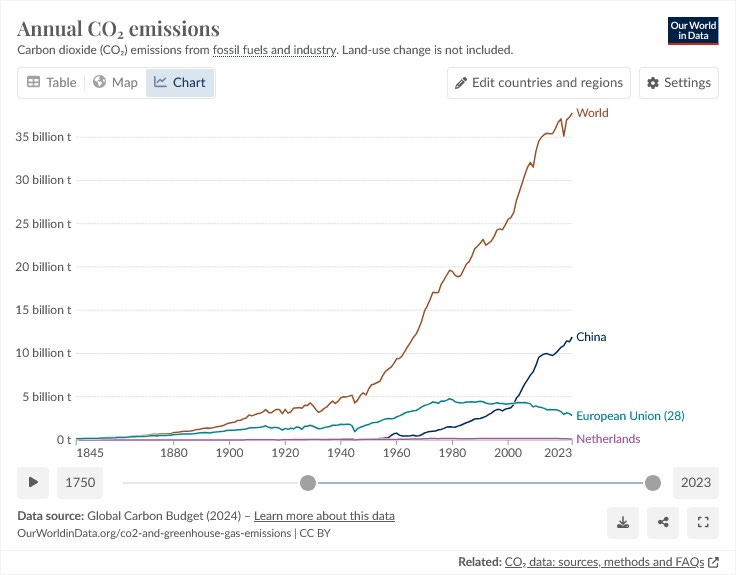
How do politicians expect European industry and Dutch farmers to compete with Turkey, the U.S., Japan, South Korea or - God forbid - China (which subsidizes its predominantly coal-generated electricity prices, contrary to popular belief)? And if they cannot compete, have workers consented to losing their jobs in the name of "saving the planet" while China isn’t in compliance with their emission reduction?
Perhaps most fundamentally, why do Western politicians assume they can mitigate climate change risks in Europe or the Netherlands by reducing their local natural gas and vegetable production, if we subsequently have to import natural gas from Qatar as LNG or likely more CO2-intensive tomatoes from Morocco?
We are on the wrong track.
Warm regards,
Alexander










This is an excellent well researched write-up. Great job!
Excellent